
Country performance: eGovernment progress across four top-level benchmarks
The eGovernment benchmark 2018 report reveals that 10 EU countries (Malta, Austria, Sweden, Finland, the Netherlands, Estonia, Lithuania, Latvia, Portugal, Denmark) and Norway are delivering high-quality digital services with a score above 75% on important events of daily life such as moving, finding or losing a job, starting a business or studying. At the same time, bottom perfoming countries are catching up bridging steadily the performance gap with the ambition to fulfil Europe's goal of creating a Digital Single Market.
Overall performance is measured as an average score of four top-level benchmarks:
- user-centricity (how fast and easy to use public information and services online),
- transparency (of government authorities’ operations, service delivery procedures and the level of control users have over their personal data),
- cross-border mobility (the extent to which people can use public services outside their country),
- key enablers (the availability of eID, eDocuments and Authentic Sources, etc).
Progress is visible for all four top-level benchmarks. Europe is most advanced in terms of User-centricity, showing that public administrations keep an eye on user needs and preferences. Despite improvements, further efforts are needed to uplift the eGovernment dimensions of Transparency, Cross-border mobility and Key enablers.
Additionally, the newly introduced cyber security assessment in the 2018 benchmark report calls for action: public administrations across Europe need to guarantee foundational security levels. Less than 10% of the 3500 analysed European public websites passed the basic tests performed.
User centricity
User centricity is the most matured top-level benchmark in Europe with an overall average of 82%. It is still improving. For instance: over the last four years, online availability has risen with 13 p.p., broadening the online scope of public services. Moreover, an initial gap between the top and bottom five performing countries of 64 p.p. was decreased with 10 p.p. over the last four years. Encouragingly, public sector services are also increasingly mobile-friendly (now standing at 62%), allowing users to find information and obtain services anytime, anywhere.
Transparency
The top-level benchmark Transparency stands at 59%, urging public entities to further embrace transparency as a key driver for trust in digital government. While analysing trends among eight life events over four years in time, it stands out that public entities have difficulties clarifying service delivery processes in a clear and transparent way (ranking 54%). Correspondingly, the digital divide of 65 p.p. between the best and worst performing countries on transparency of service delivery was only limited with 5 p.p. in comparison with the 2012 and 2013 results.
Transparency of public organisations is the highest scoring indicator of this benchmark, at 71%. Organisations are particularly clear on their mission and responsibilities, organisational structure, relevant legislation, and how users can request additional information.
Cross-border mobility
The top-level benchmark Cross-border mobility reaches 54% and reveals that the Digital Single Market needs focussed attention to open digital borders for both citizens and businesses. Nevertheless, a positive trend is continued: the online availability of services to non-national users scores 66%, compared to 43% four years ago. Furthermore, and compared to the life events measured in 2012 and 2013, the current cross-border online availability level shows that the least performing countries are catching up, closing the initial gap of 44 p.p. with 11 p.p. effectively.
Key enablers
The top-level benchmark Key enablers scores 54%, showing European nations have ample room to implement key enablers in their service processes. Public administrations could for instance optimise reuse of (personal) information already provided by users. In effect, the authentic source indicator holds at 53%, although countries substantially differ. This difference between the top and bottom countries has only lowered with 4 p.p. in four years (originally at a 78 p.p. difference).
An explorative benchlearning perspective
To stimulate progress, countries with similar characteristics are compared on their eGovernment performance through selected complementary indicators from external sources focussing on the level of adoption and of investment in digital technologies. Such a benchlearning exercise helps to understand which contextual factors promote or hamper innovation. eGovernment performances are measured by two proxies: Penetration and Digitisation.
- Penetration captures the adoption of eGovernment services online. The overall European level of Penetration is 53%, with countries showing a wide range of scores.
- Digitisation proxies the digitisation level of the back and front offices of public administrations. It encompasses the four eGovernment Benchmark’s top-level benchmarks. Europe’s Digitisation level marks at 63%, with countries obtaining more similar scores than for Penetration
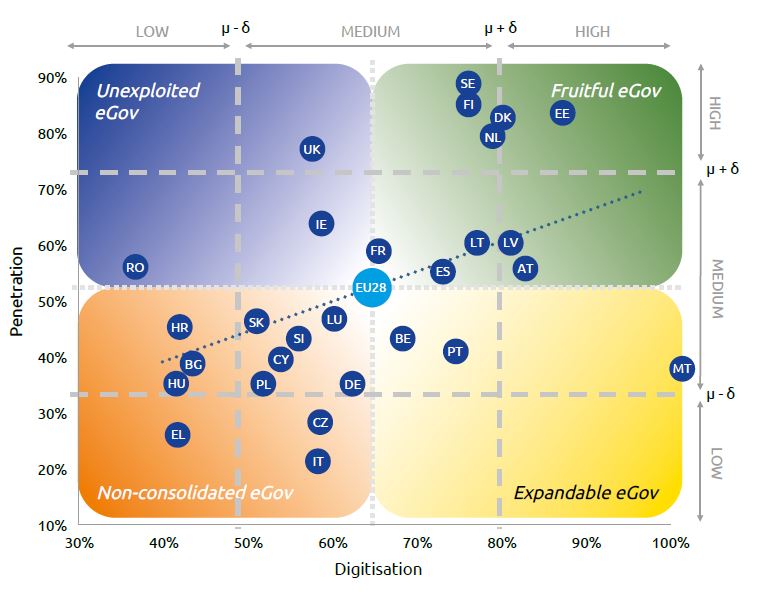
Estonia, Latvia and Lithuania are the outperforming countries in both Digitisation and Penetration. Taking into account country characteristics, Finland, Sweden and Romania are outperforming in Penetration and perform on average on Digitisation. The United Kingdom is outperforming on Penetration but underperforming in Digitisation. Austria, Portugal and Spain are outperforming in Digitisation, and show average performance on Penetration. Malta is outperforming on Digitisation but underperforming in Penetration.
Bulgaria, Denmark, France, Greece, the Netherlands, Poland, Slovenia all perform in line with the performance expected based on their characteristics.
Belgium, Cyprus, Czech Republic, Italy and Germany are underperforming in Penetration given their characteristics, while they perform averagely in Digitisation. Croatia, Hungary, Ireland and Slovakia are underperforming in Digitisation, while performing in line with Penetration averages. Luxembourg shows a relative performance below the European trend, both in Penetration and in Digitisation.
Background
The 15th eGovernment Benchmark report is the sixth edition of the measurement made according to the eGovernment Benchmark Framework 2012-2015. It evaluated progress on key components of the eGovernment Action Plan 2016-2020, the Tallinn Declaration and the accomplishment of a European Digital Single Market. A complete measurement of all eight life events takes two years, covering public services related to four government domains each year: business start-up, losing and finding a job, studying and family life, as well as regular business operations, moving, owning and driving a car and starting a small claims procedure. Given the methodological update in 2016, only a select number of indicators allow for comparisons over time.
eGovernment Benchmark material
- The eGovernment Benchmark 2018 Insight Report provides an overview and description of the main results
- The eGovernment Benchmark 2018 Background Report offers further details and conclusions on specific life events and good practices
- The eGovernment Benchmark 2018 country factsheets offer concise country analysis
- The eGovernment Benchmark Framework 2012-2017 method paper describes the methodology used in the study
- The eGovernment Benchmark 2018 Infographics shows the best performers in four categories
- The Cybersecurity Assessment method for the eGovernment Benchmark describes the methodology used for the Cybersecurity Assessment
- The Source data file offers the underlying data being used for the eGovernment Benchmark report